Statutory Data 2024-25
EYFS
81% of our pupils achieved the Good Level of Development in 2024-25. The estimated National average is estimated to be 69%.
St. Mary’s has exceeded the national average for GLD results for the last 5 years.
Phonics
95% of our pupils passed the Phonics Screening Check in 2025. The is well over the national average of 80%.
Multiplication Tables Check (MTC)
In 2025, 30 pupils took the MTC and 57% of these pupils scored full-marks (25/25). This is well beyond the national average of 37%. This is the third year in a row where St. Mary’s have exceeded the national average.
Compare our school performance data with other schools in the area by clicking:
https://www.compare-school-performance.service.gov.uk/school/140775
Key Stage 2 2024-2025
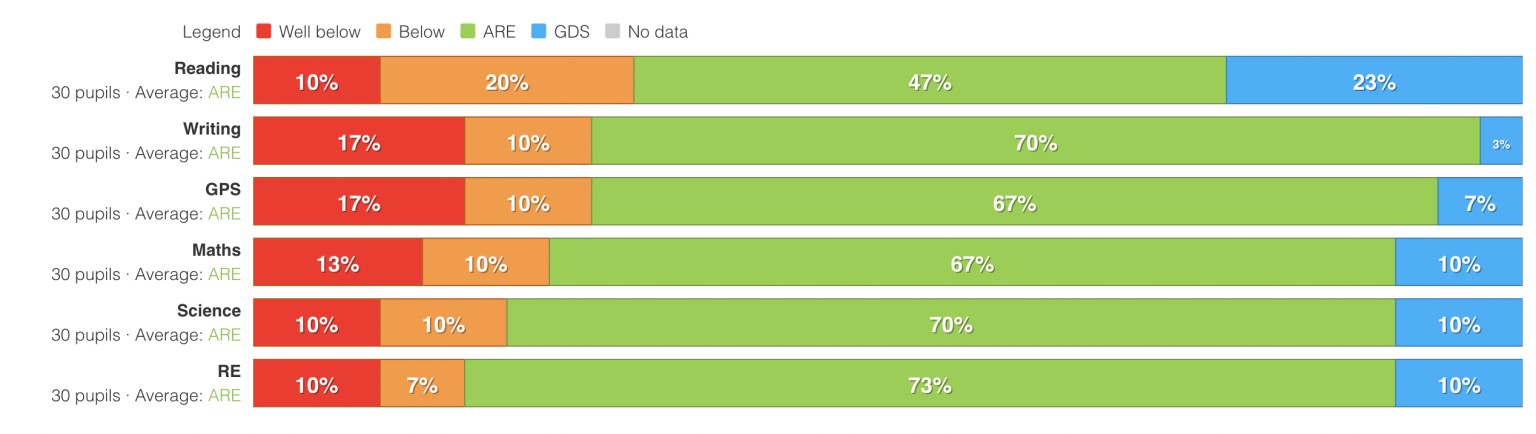
In 2025, 70% of pupils at St. Mary’s achieved at or above the Expected Standard in Reading and 27% achieved the Greater Depth Standard.
In 2025, 75% of pupils met the standard nationally.
In 2025, 73% of pupils at St. Mary’s achieved at or above the Expected Standard in writing. In 2025, 72% of pupils met the standard nationally.
In 2025, 70% of pupils at St. Mary’s achieved at or above the Expected Standard in mathematics. In 2025, 74% of pupils met the standard nationally.
In 2025, 60% of pupils at St. Mary’s achieved the Expected Standard in Reading, Writing and Maths combined. This national average was 62%.
In 2025, 63% of pupils met the standard in Grammar Punctuation and Spelling (GPS) and 20% exceeded it. 73% of pupils met the standard nationally.
In 2025, 83% of pupils achieved the Expected Standard in Science, compared to 82% of pupils nationally.
Scaled Scores
The average scaled score for reading for pupils at St. Mary's was 105.1, compared to a national average of 106.0.
The average scaled score for maths for pupils at St. Mary's was 103.4, compared to a national average of 105.0.